


Redis Sentinel, learning from scratch to deploy to production environment
Redis sentinel on premise

Why pick Sentinel, not Redis cluster or other stacks?
I don’t need high performance on Redis, only high availability because in the current application, Redis down means the whole application is down/affected which is not good for business.
There is a need to auto-failover the current Redis master-slave mode instead of manually promoting the slave every time the current master goes down.
There is a need to replace the KeyDB stack ( I used this to replace Redis master-slave ) which has a lot of problems after use and discovered, the list of issues is below:
https://github.com/Snapchat/KeyDB/issues/365
https://github.com/Snapchat/KeyDB/issues/794
https://blog.palark.com/keydb-multi-master-and-active-replica/
Redis Sentinel introduction
Redis sentinel has been released for a long time. If you haven’t known about it, please take a look here: https://redis.io/docs/latest/operate/oss_and_stack/management/sentinel/
Some quick notes about it:
Sentinel is a distributed system with multiple processes running in sentinel mode.
Runs independently of the Redis Server process.
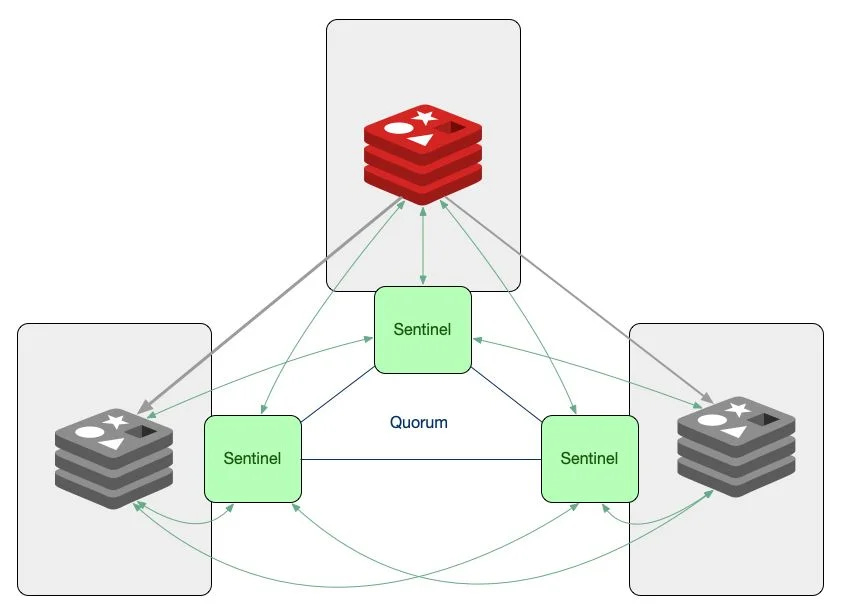
Let me give you an easy example to imagine: Sentinel runs in port 16739 while Redis runs in port 6379, The Client connects directly to Sentinel instead of the Redis server, and the client asks Sentinel which instance is the current master and connects to that. When the current master goes down, Sentinel will promote a slave to a new master and the client won’t be affected xD
Time to install some demos and do lab
While doing Google, I found this article: https://docs.vultr.com/set-up-high-availability-redis-using-sentinel-in-ubuntu. And there was an ansible module in there, pretty easy-to-run demo. Now the tool is available, we will deploy testing instances with 3 Redis and 3 Sentinel instances
After quick testing like the shutdown single Redis master, shutdown single Redis sentinel, and shutdown of complete server.
Everything went as expected, I managed to prepare some client code to connect for the demo, like Python, Golang, Nodejs, PHP - Laravel, and Java - Springboot.
The first introduce Redis Sentinel to my team.
It is something not new, but still needs introduced again xD. After some discussion, there is some feedback, issues raised like this:
Need support more than 1 port in a single cluster ( like port 6379, 6380, 6381… and so on with Sentinel ) because there are currently around 50-70 Redis ports with standalone / master-slave with Haproxy in front but they are not auto-failover for sure xD. I said that because in the guide I took from Vultr which has ansible module support only for one port.
A suggestion that research for Redis operator in K8S, but currently there is no reliable storage for Persistent Volume, we used Longhorn as storage for K8S but it will have some problems when network flapping which forces us to detach and attach volume again! So this option is not good until we have built and mastered our Cephfs cluster? xDD
Research more with Redis backend + Haproxy frontend because with Sentinel, clients need to change their config code to connect and maybe some legacy applications don’t support Sentinel.
The first update after feedback and suggestion
I know the diagram is ugly AF xD

A quick explanation for this diagram: Redis and Sentinel for the backend, Haproxy for the frontend, all of them are running on the same server for each process.
Redis + Sentinel: Sentinel for failover, Redis for master-slave instance
Haproxy + Gdnsd: provide an endpoint for the client to connect, the client no need to change anything during the failover process
Sample config for Sentinel, Haproxy, and GDNSD
Haproxy: use Google and there are many examples you can understand
https://blogs.oracle.com/cloud-infrastructure/post/deploying-highly-available-redis-replication-with-haproxy-on-oracle-cloud-infrastructureGdnsd ( for Sentinel, assume Redis instance on port 6800 and Sentinel on port 16379 )
# Config domain
test-redis-16379.kienlt 30 DYNA metafo!redis-16379-kienlt

# Config monitor
monitor-port-16379 => {
  plugin => tcp_connect,
  port => 16379, # required
  up_thresh => 30,  # 30 checks * 10 seconds interval = 300 seconds delay
  ok_thresh => 10,
  down_thresh => 3,  # Updated to 3
  interval => 10,    # Keep it at 10 seconds
  timeout => 2,
}

# Config metafo
redis-16379-kienlt => {
    datacenters => ["dc1", "dc2", "dc3"],
    service_types => "monitor-port-16379",
    dcmap => {
        "dc1" => "10.0.0.10",
        "dc2" => "10.1.0.10",
        "dc3"  => "10.2.0.10"
    },
    failover_ttl => 60, # This determines how long GDNSD will wait before checking the failed resource again. By setting this to a higher value, you can prevent rapid switching back to the original IP
}
Sentinel:
sentinel monitor 16379-sentinel-data-svc 10.5.92.19 6800 2
sentinel auth-pass 16379-sentinel-data-svc pass_here
sentinel down-after-milliseconds 16379-sentinel-data-svc 5000
sentinel failover-timeout 16379-sentinel-data-svc 30000
sentinel parallel-syncs 16379-sentinel-data-svc 2
+ down-after-milliseconds: time for 1 instance counted as unreachable
+ failover-timeout: timeout for failover process
+ parallel-syncs: number of replica can be re-configure to master after failover process (this is one of reason make some unwanted issue later, details will be below )
Time to test the new setup
Shutdown whole instance which contains Redis (with the role Slave) + Sentinel+Haproxy: Everything is still fine
Start the shutoff instance, wait for 5 minutes, and check with the test script: It’s still fine.
Shut down the whole server which has Redis role as master: failover process occurred and no problem at all.
Random shutdown component, sometimes shut down both of 2 slaves: everything still fine till now.
First time test in a sequence is looking good and promising, but it is not really good like that. I did test more detail and more issues happened! Here is the issue list:
Sometimes Haproxy returns 2 backends at the same time, because of the output of info replication via redis-cli, there are 2 instances where having role is master at the same time!
The master-slave role. For example, node1 is the master, node2 is a slave of node1 but node3 is a slave of node2 instead of node1, sentinel changes master often which is not stable for me.
Haproxy sometimes returns the backend but it is a slave —> client gets an error
You can't write against a read onlyGdnsd issue: metafo type sometimes returns magic address xD
Command: dig +short test-redis-16379.kienlt.local
;; ANSWER SECTION:
test-redis-16379.kienlt.local. 30 IN  A  10.0.0.10
test-redis-16379.kienlt.local. 30 IN  A  0.0.1.44
How do I solve those issues?
The first and second issues seem related to
parallel-syncs = 2,changing it to 1, the issue no longer happens. If I’m wrong please correct me!For the Haproxy issue, I asked some members who have strong knowledge about Haproxy xD, to tell them my problem, after a morning of Saturday research together. The keyword to solve it is:
on-marked-down shutdown-sessions.After that, the issue no longer happens.For the Gdnsd issue: change to use multifo instead of metafo. It will always try to return the first IP, for example, shutdown instance 10.0.0.10, after some time, start it again, and the DNS will point back again to it, even if it is not the current master
    dcmap => {
        "dc1" => "10.0.0.10",
        "dc2" => "10.1.0.10",
        "dc3" => "10.2.0.10"
    }
Why did I choose 1 slave instance instead of 2 slaves?
First, there is a question from my leader is that able to run with 2 Redis instances instead of 3? I was conservative without researching carefully before answering xD, so that is my fault but after that with quick re-research, I realized 2 Redis instances and 3 sentinel is enough to run.
Easy to control: there is a command that allows you proactive choose which server becomes the master. In the current setup, I used 1 VM and 2 cloud servers ( OpenStack with Cephfs is storage, I’m a user, not who set up Cloud infrastructure xD ). So I will always prefer a VM instead of the cloud, in case need to maintain a VM or the VM dies, the cloud server is strong enough to become master.
redis-cli -h $SENTINEL_IP -p $SENTINEL_PORT sentinel failover $MASTER_NAMEComplicated algorithm of Redis Sentinel for choosing a slave to promote to master: Replica Priority, Replication Offset, Run ID. Replica priority and offset I can understand, but what the heck is Run ID, if you are interested in it, read it here: https://redis.io/docs/latest/operate/oss_and_stack/management/sentinel/#sentinels-and-replicas-auto-discovery xD
The application using Redis is not gonna using replicas for the tasks that do not need Redis real-time like analytics, or reporting jobs. So 2 replicas are a waste of resources.
Why not use stack Keepalived and Haproxy?
Keepalived and Haproxy are good when VIP is available, but in my infrastructure, I work with Multi Datacenter and currently, there is no VIP option available with VM and OpenStack.
Notification when the failover process happens?
Notification. Sentinel can notify the system administrator, or other computer programs, via an API, that something is wrong with one of the monitored Redis instances
I used a simple Python script that will send to telegram API every time I run it to let me know Redis sentinel just failover. It sent 12 messages in a row with 1 instance and a total of 36 messages with 3 Sentinel instances >.>?
I tried to research a little quick and got this:
There is a reply marked as an answer ( from 2016 ):
import sys

def main(args):
    for arg in args:
        if arg == "+odown":
            print "HEY SOMETHING IS UP WITH REDIS"
            email_text_or_whatever_thing_you_wanna_do()

main(sys.argv)
I realized something and started to count the lines of the sentinel log when the failover process happened, it was 12 lines, the same as messages sent to Telegram via API. So each line is treated as an argument. Ok, time to write the script ( actually I used Copilot from Github to generate code xD ), after telling it modified to actually I like. Here is the output:
Notification Script in Github Gist
After uploading the script to 3 servers, this is an example output from the Telegram message
Redis Slave/Sentinel/master is up, please review to make sure it works!
Trigger Event: -sdown
Service: data-crm
Port: 6800
Cluster: kienlt-dev
Sentinel IP: 10.0.0.10
Hostname: kienlt-redis-sentinel-1
Full Args: '/opt/notify_redis_6800.py', '-sdown', 'slave 10.0.0.10:6800 10.0.0.10 6800 @ 26800-sentinel-data-crm 10.1.0.10 6800'


Redis Slave/Sentinel/master is up, please review to make sure it works!
Trigger Event: -sdown
Service: data-crm
Port: 6800
Cluster: kienlt-dev
Sentinel IP: 10.1.0.10
Hostname: kienlt-redis-sentinel-2
Full Args: '/opt/notify_redis_6800.py', '-sdown', 'slave 10.0.0.10:6800 10.0.0.10 6800 @ 26800-sentinel-data-crm 10.1.0.10 6800'


Redis Slave/Sentinel/master is up, please review to make sure it works!
Trigger Event: -sdown
Service: data-crm
Port: 6800
Cluster: kienlt-dev
Sentinel IP: 10.2.0.10
Hostname: kienlt-redis-sentinel-3
Full Args: '/opt/notify_redis_6800.py', '-sdown', 'slave 10.0.0.10:6800 10.0.0.10 6800 @ 26800-sentinel-data-crm 10.1.0.10 6800'
My goal is when sentinel failover, we know and check to make sure the sentinel is processing correctly. But seems not optimized yet, because when failover happens, there are 3 notify from 1 instance, for 1 port, it would be 9 notifications in total. And I’m going to deploy 5-10 ports in 1 cluster. It would be spam notification for me and also I don’t want a new channel because currently, a lot of channels for monitoring like SSH login, wazuh, Checkmk, Alert Manager, K8S….
So what is the solution for optimizing sentinel failover notification: I used exists stack I used for monitoring, which is CheckMK
I used plugin
check_log3.pl.Example usage atmrpe.cfgwill be like this:
Redis-Sentinel::6800 /usr/lib/nagios/plugins/check_log3.pl -c 1 -l /var/log/redis/8800-sentinel-service-name.log -p "odown" -p "sdown" -s /tmp/8800-sentinel-rd-coupon.seekI used the Business Intelligence (BI) of CheckMK to optimize notify: https://docs.checkmk.com/latest/en/bi.html
Detailed failover progress
How to test
Simple Python clients write continuously into Redis with 10 random keys/value batch and sleep 5 seconds next to write.Test with Redis Sentinel + HA + DNS
Information:
Hostname                            IP
kienlt-redis-sentinel-1             10.0.0.10
kienlt-redis-sentinel-2             10.1.0.10
kienlt-redis-sentinel-3             10.2.0.10
Check the current status of master-slave:
root@kienlt-redis-sentinel-1:/data/redis-config# redis-cli -p 6800 -a 123123 info replication|head -n3
# Replication
role:master
connected_slaves:1

root@kienlt-redis-sentinel-2:/data/redis-config# redis-cli -p 6800 -a 123123 info replication|head -n 3
# Replication
role:slave
master_host:10.0.0.10
Below is the output of the application, written continuously with some small records ( write 10 keys and sleep every 5 seconds to be easy to watch ). Link to the output of the test: Github Gist, it may be a little hard to read unless you have an idea of what you are doing, but don’t worry, there will be a summary at the end xD
Test with Redis Sentinel Only
The output here: Github Gist. I tried to add a Golang client for testing, it was much faster than Python in my opinion.
So with many test cases, run, repeat for a lot of time. Each time I saw some issue, I re-configured, tuning until I got the best result.
You wrote it too long with too much text, have you finished yet?. No xD
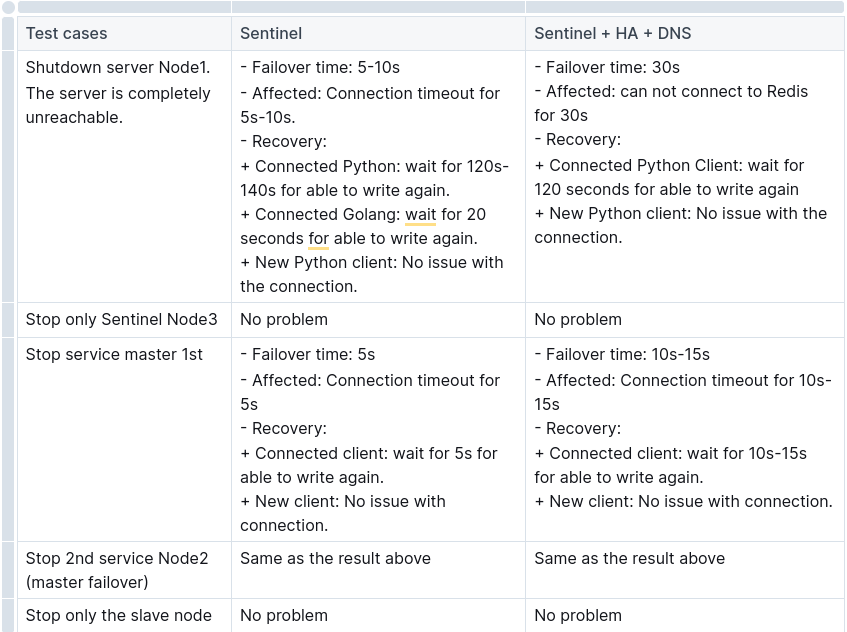
Summary Test Report
Redis + Sentinel + HA + DNS
- Node1: Redis + Sentinel + Haproxy + DNS (init master)
- Node2: Redis + Sentinel + Haproxy + DNS (init slave )
- Node3: Redis + Sentinel + Haproxy + DNSRedis + Sentinel
- Node1: Redis + Sentinel (init master)
- Node2: Redis + Sentinel (init slave)
- Node3: Sentinel only
Comparison & Conclusion
Simple compare
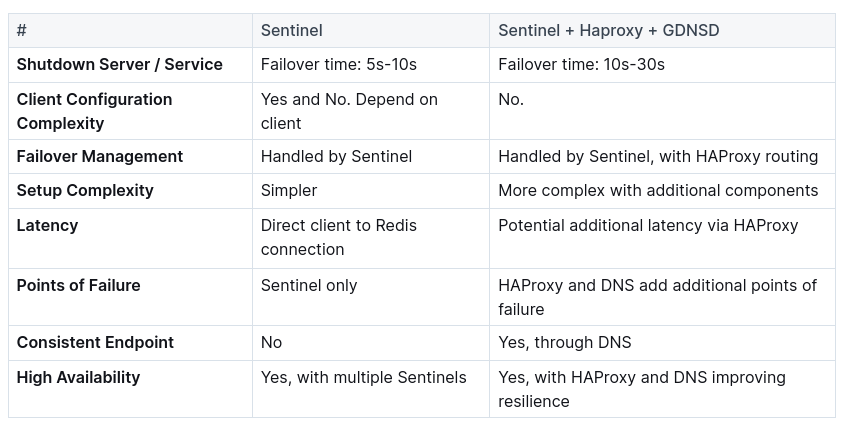
Conclusion
Redis Server + Redis Sentinel:
Ideal for simpler setups where client-side complexity can be managed and where advanced load balancing is not critical.
It provides automatic failover and high availability with a straightforward configuration.
Redis Server + Redis Sentinel + HAProxy + DNS:
Suitable for more complex environments requiring simplified client configuration.
Provided a consistent connection endpoint.
This setup offers improved traffic management and fault tolerance but comes with increased setup complexity and potential additional latency.
Metrics/Dashboard setup
Example metrics setup for Prometheus/Victoriametrics:
  - job_name: redis-c1-exporter-port9800
    static_configs:
    - targets:
      - 10.0.0.10:9800
      - 10.0.0.20:9800
      labels:
        cluster_name: kienlt-dev
        service: redis-data1
    relabel_configs:
      - source_labels: [__address__]
        target_label: instance
      - source_labels: [service]
        target_label: service

  - job_name: redis-c1-exporter-port9801
    static_configs:
    - targets:
      - 10.0.0.10:9801
      - 10.0.0.20:9801
      labels:
        cluster_name: kienlt-dev
        service: redis-data2
    relabel_configs:
      - source_labels: [__address__]
        target_label: instance
      - source_labels: [service]
        target_label: service
Why labels?
With the default Grafana dashboard, it will look like this:

With custom labels for cluster select ( assume I have prod/dev cluster)


Those variables come from here:

You can see I did some custom panels to show the current Slave or Memory Limit which doesn’t come with the default dashboard, you can set your custom also if you need other metrics!
Deploy with Saltstack
Public repo here as a sample: https://github.com/BlackMetalz/saltstack-public
Please read file README.md in salt/redis-sentinel/README.md for instruction
Fork and modify if you want to change something xD
Deploy with Ansible
Public repo here as a sample: https://github.com/BlackMetalz/ansible-playbook-public
Fast setup of Redis server + Redis sentinels.
Easy management.
What is still missing or not mentioned in this?
The secret is still in the git repo ( I will write a guide later for integrating Saltstack/Ansible with Hashicorp Vault for the secure secret! )
Nothing about the Redis cluster or Redis authorization.
Reference
Grammar correction by extension Grammarly xD